> ## Documentation Index
> Fetch the complete documentation index at: https://openrouter.ai/docs/llms.txt
> Use this file to discover all available pages before exploring further.
# Logs
> Inspect individual generations, upstream requests, sessions, and async jobs from your OpenRouter dashboard
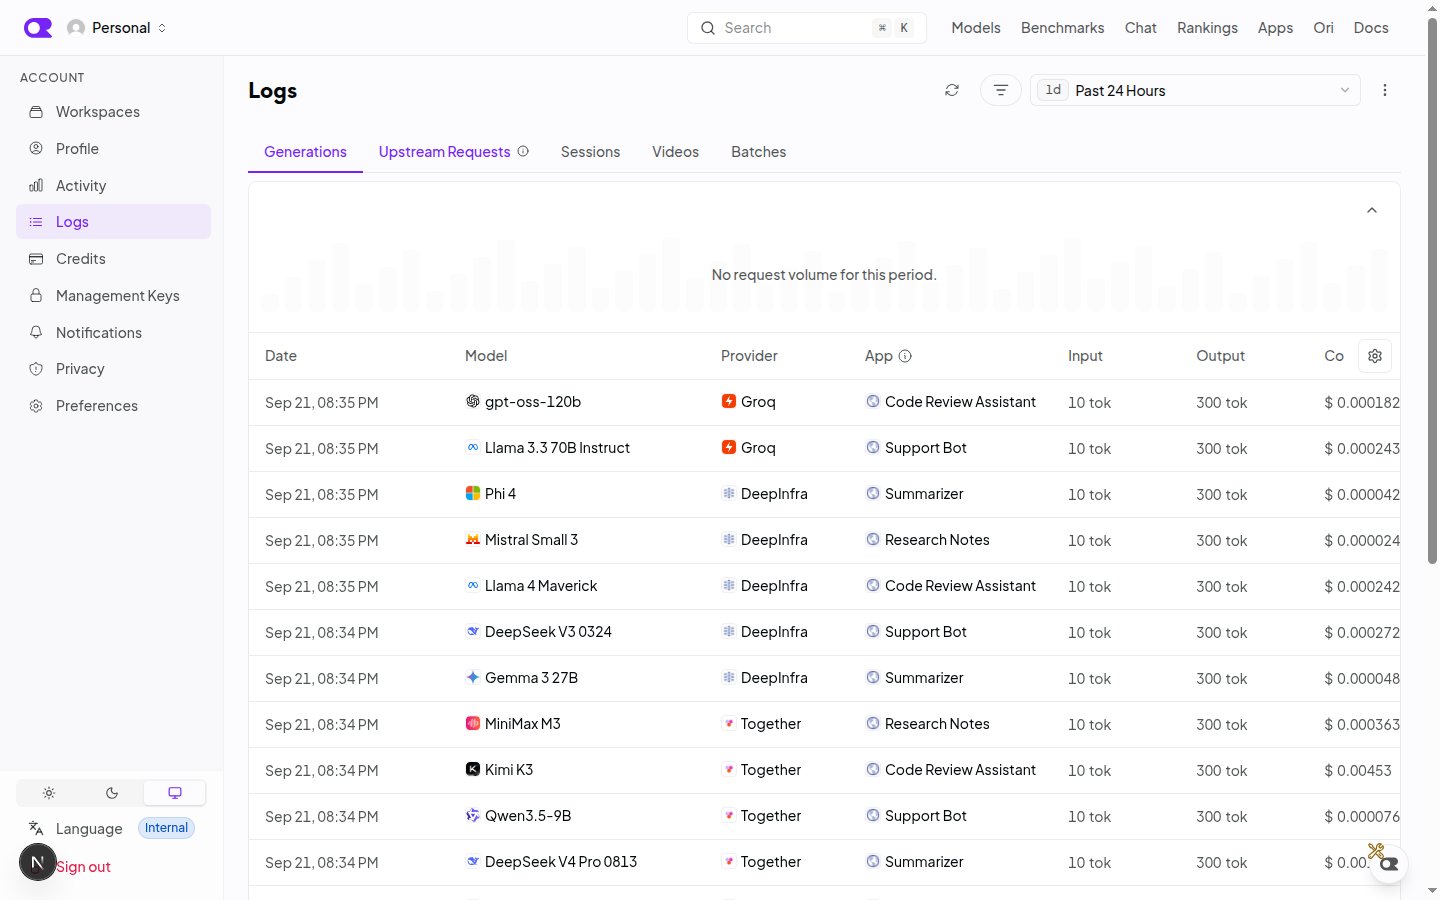
The [Logs](https://openrouter.ai/logs) page is the request-level view of OpenRouter's observability suite. Where [Activity](https://openrouter.ai/activity) aggregates usage into charts, Logs shows you each generation as it happened: which model and provider served it, how long it took, what it cost, and, if you have enabled Input & Output Logging, the exact prompt and completion.
 ## Tabs
The Logs page is split into tabs by the kind of record you want to inspect.
| Tab | What it lists |
| --------------------- | ----------------------------------------------------------------------------------------------------------------------------------------------------- |
| **Generations** | One row per completed generation, with date, model, final provider, generation ID, status, attempts, API key, and latency. This is the default tab. |
| **Upstream Requests** | Individual routing attempts to upstream providers, including retries and fallbacks. Requests that failed before being sent upstream are not included. |
| **Sessions** | Generations grouped by session, showing the primary and supporting models, the primary provider, request count, and total cost. |
| **Videos** | Asynchronous video generation jobs and their status. |
| **Batches** | [Batch API](/docs/batch-quickstart) jobs and their status. |
Organization accounts also see an **Org Member** column so you can attribute generations to the member whose API key made the request.
## Filtering
Use the filter bar above the table to narrow the list by user, model, provider, status, region, API key, or modality, depending on the tab. You can also filter by a specific generation ID to jump straight to one record. Filters are stored in the URL, so you can bookmark or share a filtered view.
A request histogram above the table shows volume over the selected date range so you can spot spikes before drilling into individual rows.
## Generation details
Click any row to open the generation detail sheet.
## Tabs
The Logs page is split into tabs by the kind of record you want to inspect.
| Tab | What it lists |
| --------------------- | ----------------------------------------------------------------------------------------------------------------------------------------------------- |
| **Generations** | One row per completed generation, with date, model, final provider, generation ID, status, attempts, API key, and latency. This is the default tab. |
| **Upstream Requests** | Individual routing attempts to upstream providers, including retries and fallbacks. Requests that failed before being sent upstream are not included. |
| **Sessions** | Generations grouped by session, showing the primary and supporting models, the primary provider, request count, and total cost. |
| **Videos** | Asynchronous video generation jobs and their status. |
| **Batches** | [Batch API](/docs/batch-quickstart) jobs and their status. |
Organization accounts also see an **Org Member** column so you can attribute generations to the member whose API key made the request.
## Filtering
Use the filter bar above the table to narrow the list by user, model, provider, status, region, API key, or modality, depending on the tab. You can also filter by a specific generation ID to jump straight to one record. Filters are stored in the URL, so you can bookmark or share a filtered view.
A request histogram above the table shows volume over the selected date range so you can spot spikes before drilling into individual rows.
## Generation details
Click any row to open the generation detail sheet.
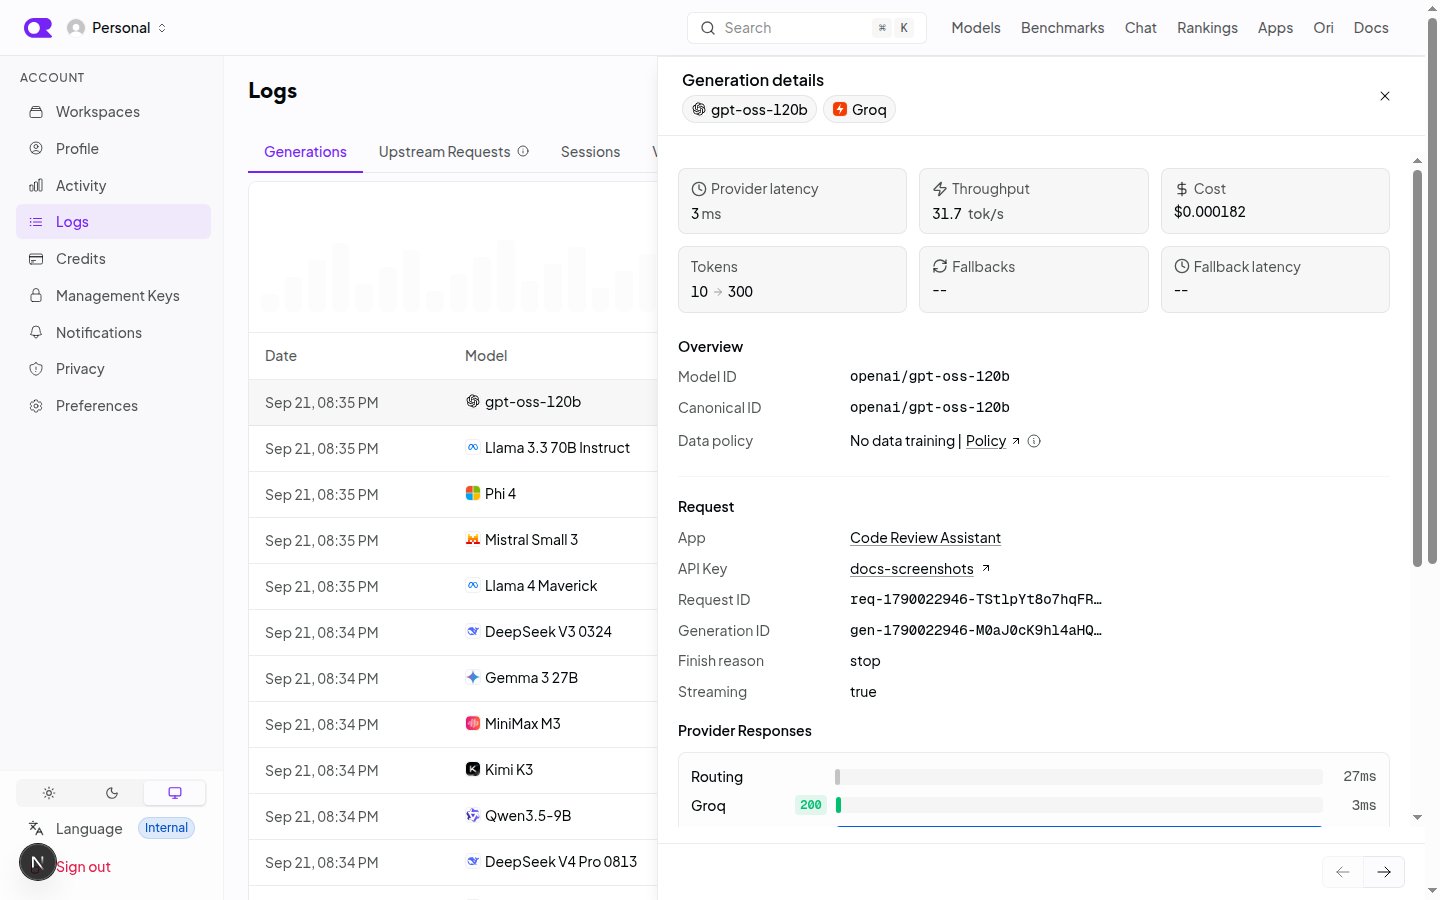 It contains:
* **Overview**: model, provider, cost, token counts, finish reason, streaming flag, provider latency and throughput, data region, and any fallbacks that occurred.
* **Provider Responses**: a waterfall of each upstream attempt in order, with latency, moderation time, and overhead, so you can see why a request landed where it did.
* **Usage**: a cost breakdown including cache read discounts, BYOK upstream cost, web search, web fetch, and file processing charges.
* **Prompt** and **Completion**: the full request and response content when [Input & Output Logging](/docs/guides/features/input-output-logging) is enabled.
* **Raw JSON**: the underlying generation record.
From the detail sheet you can also open the generation in the Chatroom or replay it in the Playground with a different model or configuration.
## Stored prompts and completions
By default OpenRouter stores only metadata about each generation. To keep the prompt and completion text as well, enable [Input & Output Logging](/docs/guides/features/input-output-logging) under **Settings > Observability**. Only generations made after you enable it will have stored content.
## API access
The same data is available programmatically. Both endpoints take the generation ID returned in the `id` field of a completion response.
| Endpoint | Returns |
| ------------------------------------------------------------------------------------------------------------------------------------ | ----------------------------------------------------------------------------------------------------------------------------------------------------------------------------- |
| [`GET /api/v1/generation`](/docs/api/api-reference/generations/get-request-&-usage-metadata-for-a-generation) | The request and usage metadata shown in the detail sheet: model, provider, tokens, cost, latency, and finish reason. |
| [`GET /api/v1/generation/content`](/docs/api/api-reference/generations/get-stored-prompt,-completion,-and-error-content-for-a-generation) | The stored prompt, completion, and error content. Requires [Input & Output Logging](/docs/guides/features/input-output-logging) to have been enabled when the generation was made. |
## Related
* [Broadcast](/docs/guides/features/broadcast): send traces for every generation to your own observability platform.
* [Activity Export](/docs/cookbook/administration/activity-export): download aggregated usage as CSV or PDF.
It contains:
* **Overview**: model, provider, cost, token counts, finish reason, streaming flag, provider latency and throughput, data region, and any fallbacks that occurred.
* **Provider Responses**: a waterfall of each upstream attempt in order, with latency, moderation time, and overhead, so you can see why a request landed where it did.
* **Usage**: a cost breakdown including cache read discounts, BYOK upstream cost, web search, web fetch, and file processing charges.
* **Prompt** and **Completion**: the full request and response content when [Input & Output Logging](/docs/guides/features/input-output-logging) is enabled.
* **Raw JSON**: the underlying generation record.
From the detail sheet you can also open the generation in the Chatroom or replay it in the Playground with a different model or configuration.
## Stored prompts and completions
By default OpenRouter stores only metadata about each generation. To keep the prompt and completion text as well, enable [Input & Output Logging](/docs/guides/features/input-output-logging) under **Settings > Observability**. Only generations made after you enable it will have stored content.
## API access
The same data is available programmatically. Both endpoints take the generation ID returned in the `id` field of a completion response.
| Endpoint | Returns |
| ------------------------------------------------------------------------------------------------------------------------------------ | ----------------------------------------------------------------------------------------------------------------------------------------------------------------------------- |
| [`GET /api/v1/generation`](/docs/api/api-reference/generations/get-request-&-usage-metadata-for-a-generation) | The request and usage metadata shown in the detail sheet: model, provider, tokens, cost, latency, and finish reason. |
| [`GET /api/v1/generation/content`](/docs/api/api-reference/generations/get-stored-prompt,-completion,-and-error-content-for-a-generation) | The stored prompt, completion, and error content. Requires [Input & Output Logging](/docs/guides/features/input-output-logging) to have been enabled when the generation was made. |
## Related
* [Broadcast](/docs/guides/features/broadcast): send traces for every generation to your own observability platform.
* [Activity Export](/docs/cookbook/administration/activity-export): download aggregated usage as CSV or PDF.